Introduction
In 2018, Equinor released a comprehensive set of oilfield data from the Volve Field in the North Sea for public research and development. The Volve Field is located (Figure 1) approximately 200 km west of Stavanger, Norway. The field was discovered in 1993 and approved for production in 2005. Subsequently the field was decommissioned in 2018 as the oil and gas production became uneconomical. In this study, we used production data from the Volve Field. During the 2008 to 2016 period a number of wells produced oil and associated gas from this field. This case study was carried out for the partial fulfillment of the Data Analytics Boot Camp at the Rice University, Houston, USA.
Scope of the Project
Oil and gas production is a highly capital-intensive process and it is associated with high HSE risk. Therefore, a large number of sensors/gauges are used to monitor seamless production of fluids from each of the wells in a field. These sensors are generally classified into two, downhole sensors and wellhead sensors. The downhole sensors are costly due to the extreme conditions (e.g. pressure and temperature) that they need to withstand down the hole and also have associated high maintenance cost. Therefore, an opportunity to avoid installation of downhole sensors, without compromising the flow assurance as well as safety of the well is highly desired by production companies.
In this study, we explore various Machine Learning (ML) methods that could potentially predict the downhole pressure data, which traditionally is measured using a downhole sensor, from various wellhead measurements.
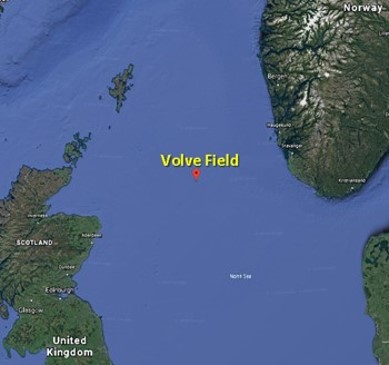
Figure 1
Production and Data Overview
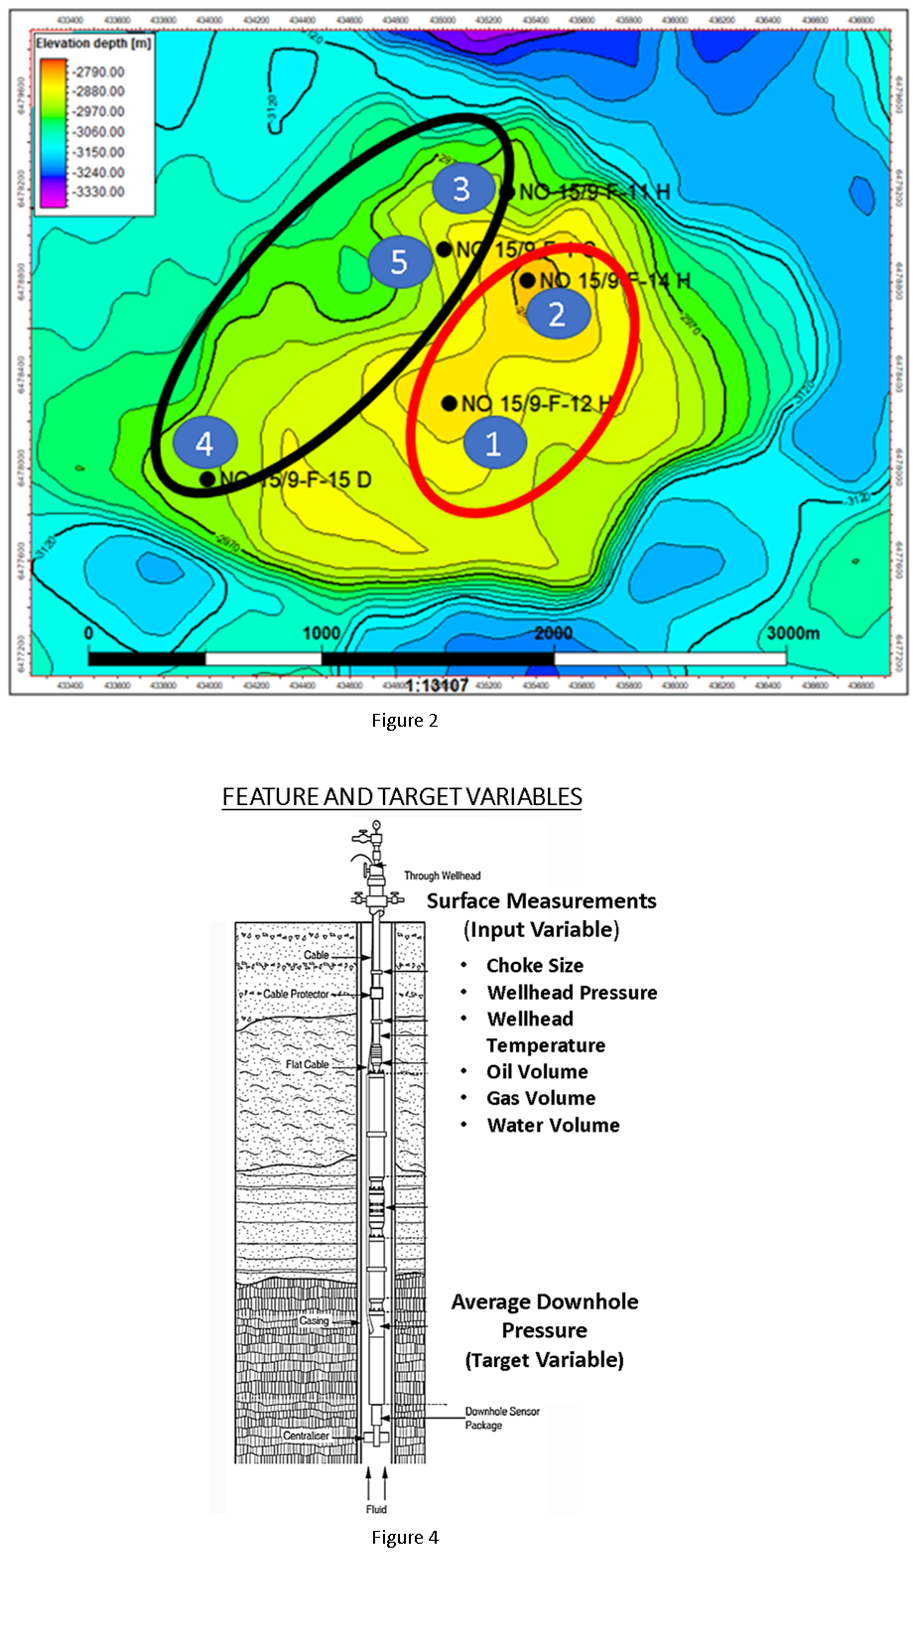
Among the data released, five wells have the complete data sets (Variables) that could be used in the ML (Figure 2). Among those five wells, two discovery wells were drilled on the crest of the structure and three appraisal wells were drilled on its flanks. All these wells are either highly deviated or horizonal in geometry. The two discovery wells started production from 2008, while the commencements of production from the three appraisal wells were by the end of 2013 and early 2014.
All the five wells got a total of 24 categorical and numerical data (Variable) from both wellhead and downhole measurements. Out of the total number of variables, five numerical variables such as, choke size, wellhead pressure, wellhead temperature, oil volume, gas volume and water volume were taken as test variables and downhole pressure was taken as the target variable (Figure 3).
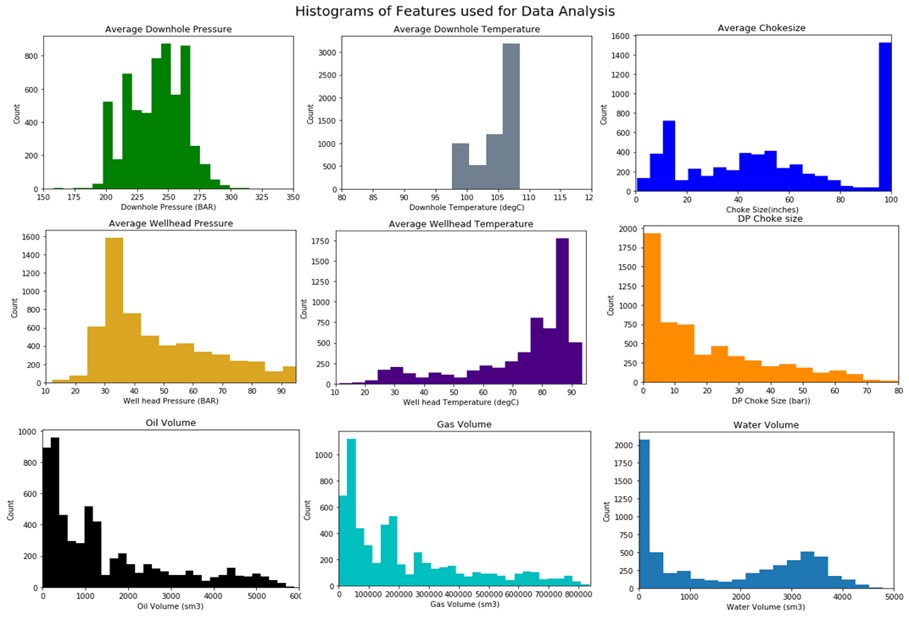
Figure 3
Project Workflow
The project was carried out in five major steps (Figure 5):
- Data audit
- Data Cleaning and Wrangling
- Exploratory Data Analysis
-
Machine Learning
- Linear Regression
- Random Forrest
- Neural Network
- Model Selection
* The machine learning methods have been fine tuned at each case for better results. The raw runs were generally provided lower coefficient
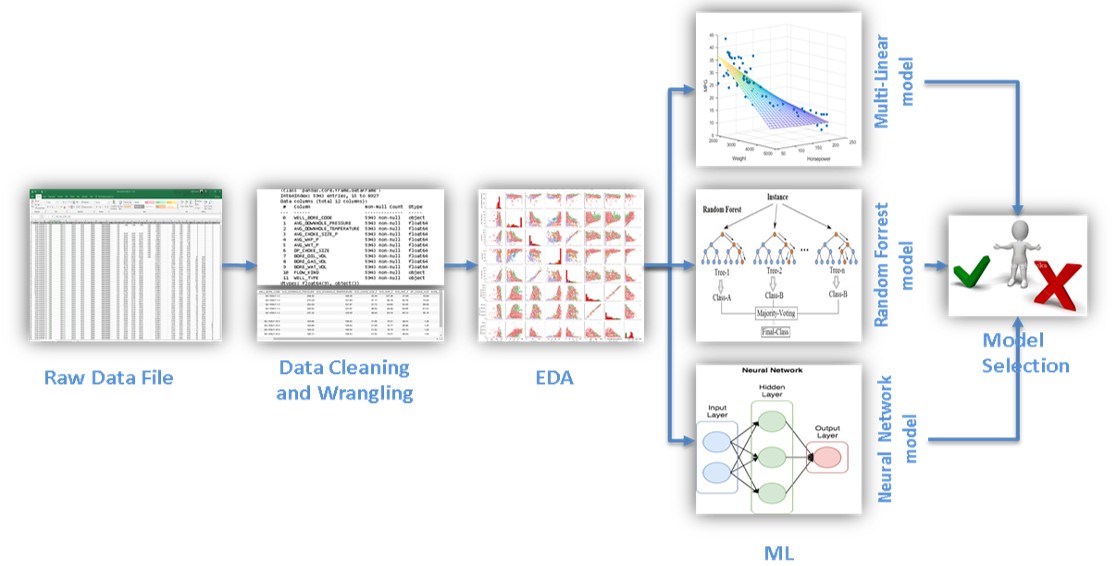
Figure 3
Model Selection & Conclusion
The three Machine Learning methods (Figure 6) provided varying levels of predictability of downhole pressure from the wellhead variables (Table 1). While the Linear regression method gave least predictability (R2 = 0.56), Neural network method provided the highest level of predictability (R2 = 0.89). Random Forrest method gave R2 value 0.82 predictability.
The study overall concludes that downhole pressure could be reasonably well predicted from the wellhead measurements, using either the Neural Network or the Random Forrest method. At the other end, the linear regression method cannot be used for reliable downhole pressure prediction.